Latest articles
Explore the Enable Blog for valuable insights and thought leadership on rebate and pricing best practices and trends.


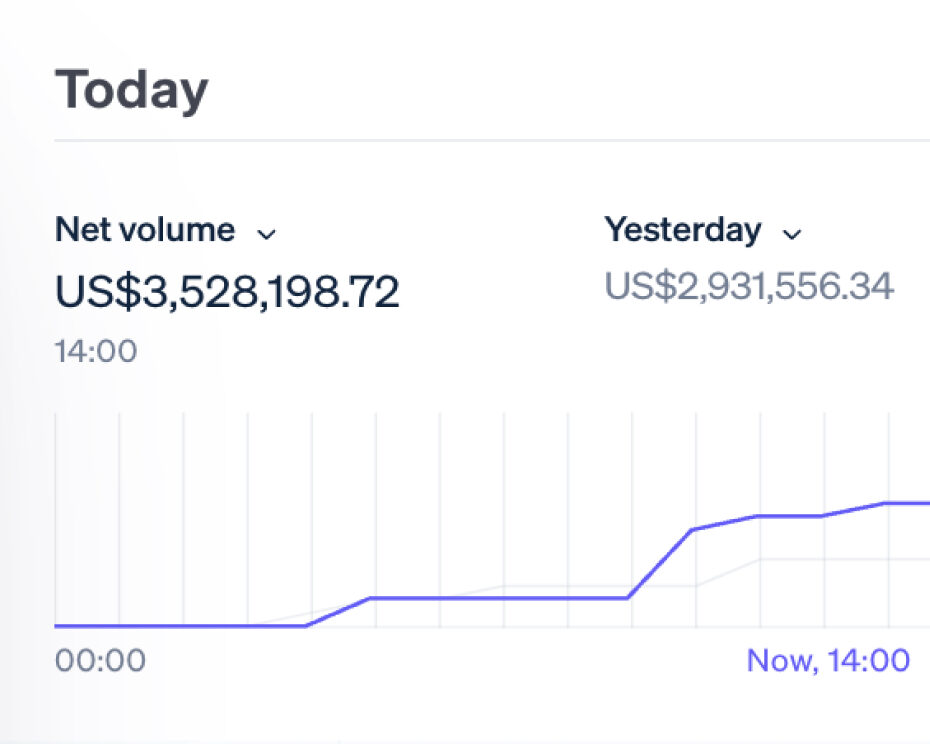
Goodbye Spreadsheets. Hello Intelligent Pricing & Rebates.
Enable connects your pricing, rebates, and real-time analytics into an intelligent commercial system.